If you are a die-hard Microsoft excel user and consider an intricate pivot table a work of art, you might find it hard to believe just how simple it is to use Microsoft Power BI.
Spending hours in deep concentration with workbooks that allow me to import data and transform it into useful reports is something I enjoy. Though i must admit the limits of spreadsheets can sometimes frustrate me and make it difficult to get the right results.The familiarity of excel can leave many who use it feel uncomfortable if asked to use another tool in its place. However, luckily in my case it didn’t take me long to see the incredible potential in Power BI when I realised just how simple it is to use.
Prior to being introduced to Microsoft Power BI we as a team used Excel to analyse and manage all our contract records, customer numbers, usage stats, frequency of billing, start and end dates etc. Our monthly reports were great, but the time spent putting this analysis together was gradually getting longer as the months went on. Finally, it got to the point where I was considering hiring a junior administrator, just to do the excel work, which sounded ridiculous, right? We wanted to work smarter, drive efficiencies in the organisation and minimise the number of hours spent on reporting not increase them. So I made the leap to finally set aside the time to understand Power BI. And I’ve never looked back….
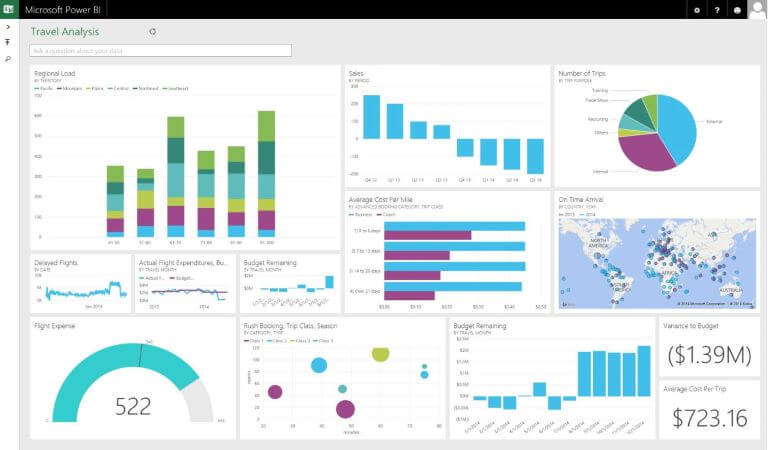
The introduction of Power BI has allowed us instant access to our data, giving us the facility to add a date slicer to each report so once a report is set up, there is no need to repeat the process each month. Simply select your new date range and the information is instantly available. Another really cool feature which I found super beneficial is the Q&A visual.This interactive feature allows you to explore your data in your own words using “natural language” by simply just asking it a question. Start either from one of the suggested questions or type your own questions, for example, I can ask for “total contracts value in Ireland for July”.
Then, like magic, Power BI will pick the data and a chart layout that best suits it, voila! You have got to try this! I’ve included a video below so you can see it in action.
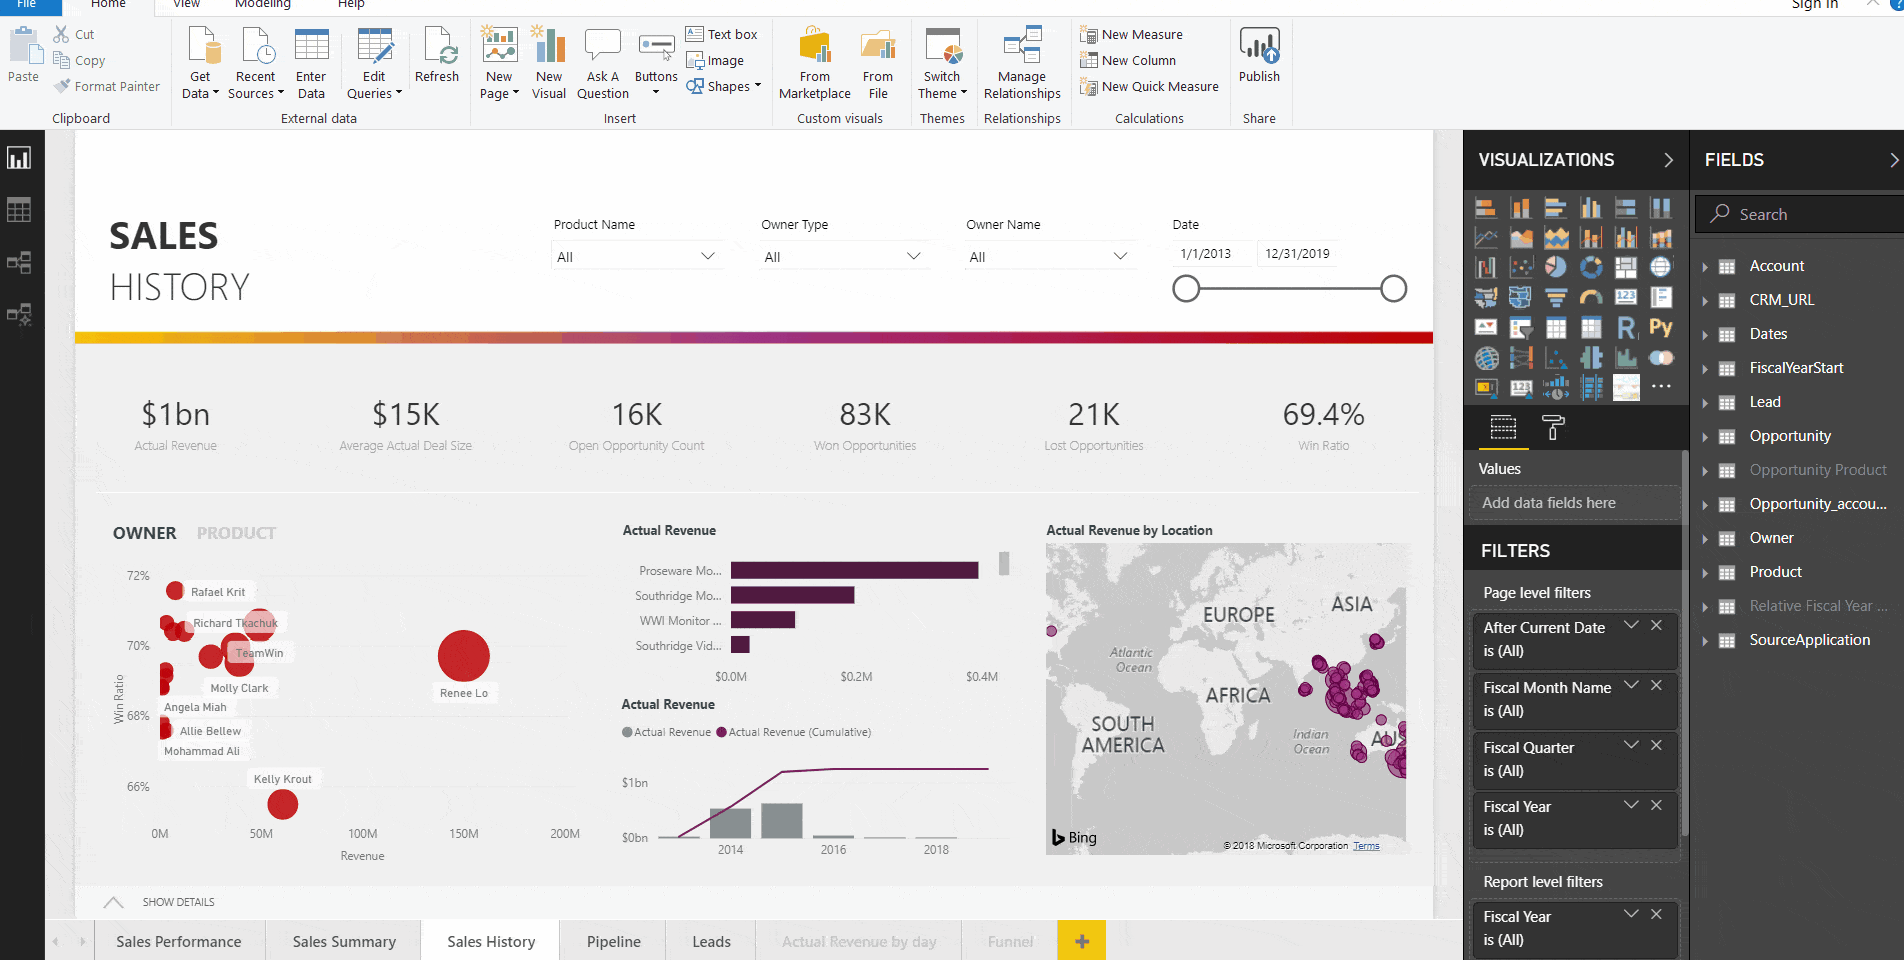
When it comes to making the move from Excel to Power BI, I can understand the reluctance. It all looks to cool and visual, that there must be more work in it. But in fact, I promise, the general design and way you interact with the data is more similar to excel than you would think at first look. There’s enough commonalities between the two that Power BI feels somewhat familiar to an Excel user even on the initial use, so it will definitely ease the learning curve.
Rest assured that transitioning from Excel to Power BI is one of the easiest and most rewarding changes you can make, you don’t even have to go on a course. If you can set aside 45 mins to work through Microsoft’s Introduction to Power BI, I guarantee you, you are already half way there. Go on Try it, It’s Free to download https://powerbi.microsoft.com/en-ie/
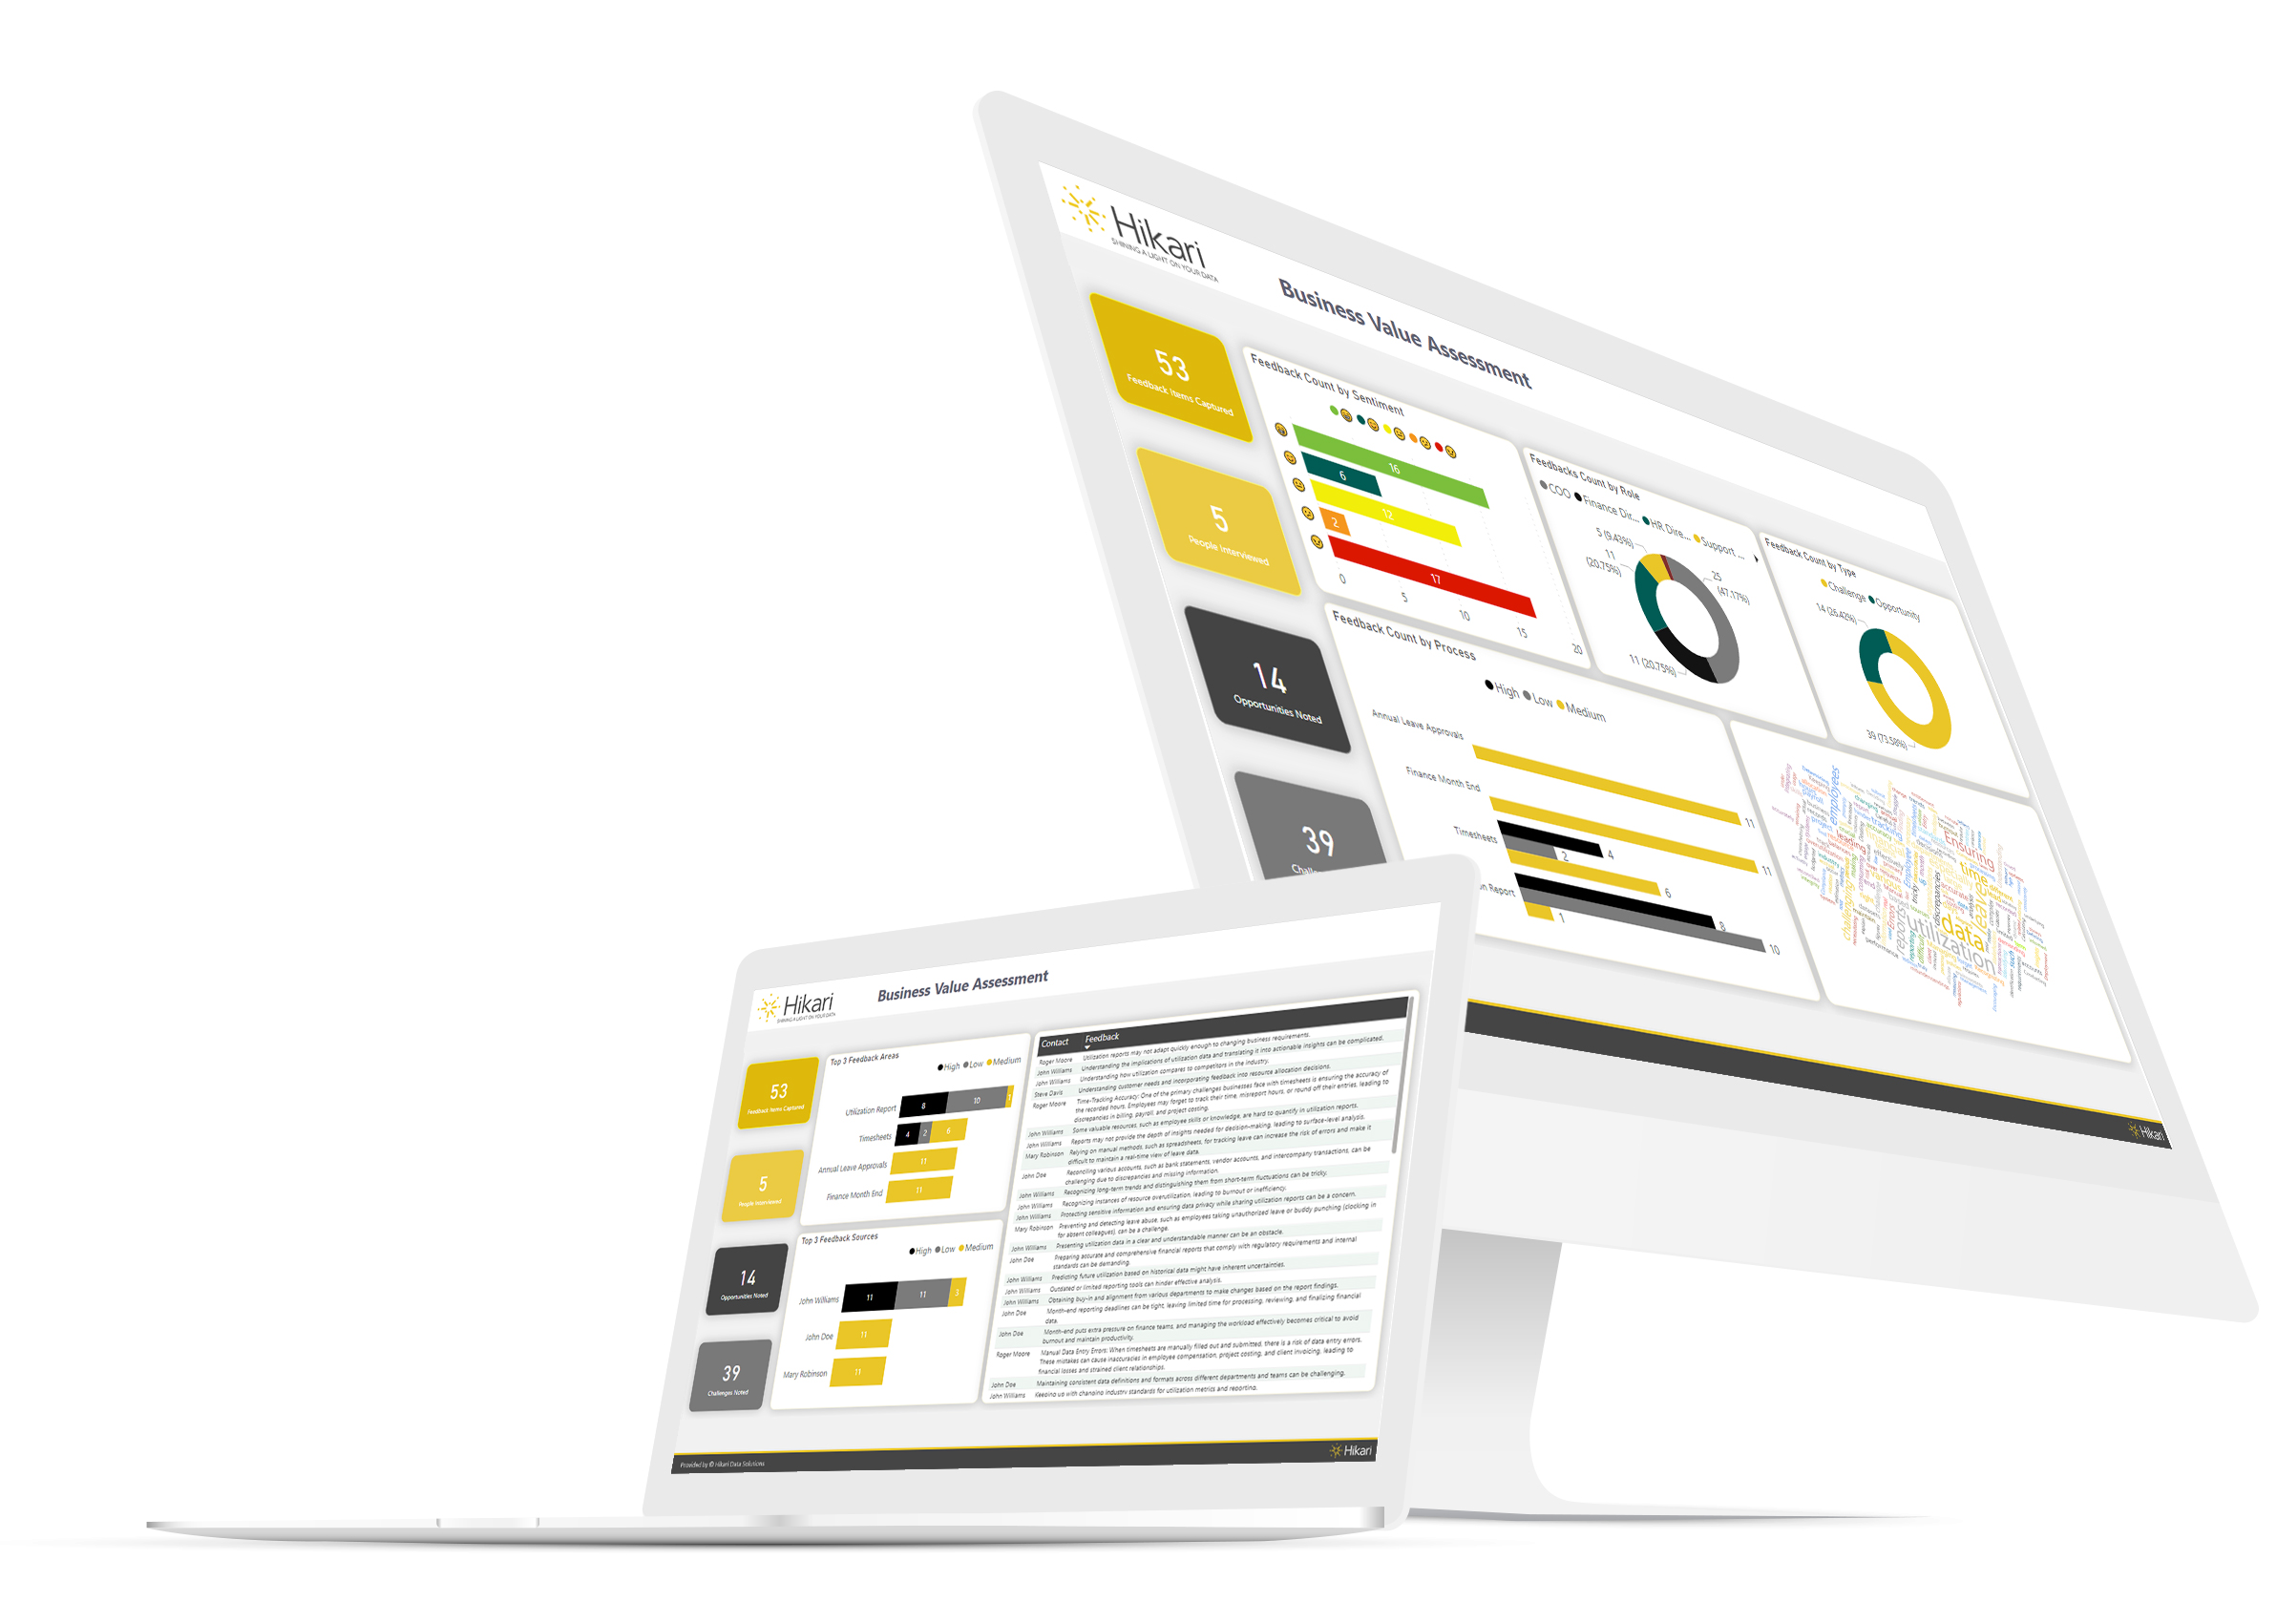
Hikari are a Microsoft Gold Partner in data analytics with great success in implementing Power BI projects across many industries.
Contact Us today to speak with one of our Power BI experts about your specific requirements.